No no, this isn't the single byte indicator at 0x2D4. Just in case you had maybe thought I lost my mind or something. I did however lose my mind over dictating whether or not they did this on purpose. Read on and post your thoughts.
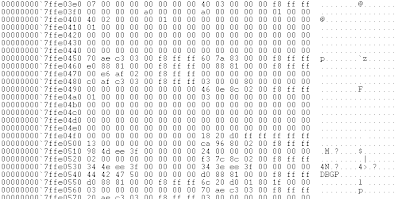
Lets imagine an operating instance with no outstanding boot flags used to enable the kernel debugger. The data beyond the xsave features area (fpu xstor features etc) may look something like this:
Nothing out of the ordinary eh?
Alright. Lets boot with /debug and com port 1
Wow would you look at all this extra data. Hey I even see a string 'DBGP'! Lets analyze what is really going on here to see if this is on purpose or just simply some kind of accident. After KiSystemStartup passes the loader parameter block to KdInitSystem, KdInitSystem dictates whether or not to initialize the kernel debugger based off of the boot parameters. It is at this point of deciding where our kernel stack is in the current state. You'll have to excuse my art skills though, no fancy crayon drawings today:
data higher
then SP. in use.
↑
RSP
↓
data lower
then SP. not
allocated (garbage)
As KdInitializeDebugger goes through it's layers of execution, needless to say it expands SP as it goes. DBGP is actually an ACPI table in which HAL determines if existing and capable debug ports do exist. For example it ensures that the com port is an actual 16550 UART. This isn't limited to just serial ports, as you know, debugging over USB/network/IEEE is also available. ACPI simply states whether or not these interfaces abide by the Microsoft debugging standard. For instance the USB host controllers must have a debug interface, or it cannot be used for this purpose.
It just so happens that during this process, the table identifier 'DBGP' is saved to the stack prior to asking HAL to look up the table ;p
Thus when KdInitializeDebugger unravels itself, this extra data along with our lovely friend DBGP still exist in the garbage portion of the stack. Ok you are with me so far, that is good, lets continue.
A short time later, KiComputeEnabledFeatures allocates itself a structure to fill for xsave features. It just so happens that this structure overlaps the garbage left behind from KdInitializeDebugger. Otherwise the structure would in fact be zeroed out because it has not been used prior. This structure is then written to the xsave features portion of the kernel/user shared page, and contains this extra information. This extra information is enough to infer presence of a kernel debugger because without /DEBUG KdInitializeDebugger is never called.
This heading is also labeled as (x64). I did look at windows in legacy operating mode but didn't notice the same results however there was some fluctuation, perhaps enough to detect the same flags. When I get more time I will have a look.
Now whether or not this is on purpose, you can decide :)
Tuesday, July 23, 2013
Tuesday, July 2, 2013
Time slip DPC kernel debugger detection
Been quite awhile since my last entry. Spent some time in Key West, FL and spent some more time moving to the other side of town. I have a some fun things to post about over the next month or so. So stay tuned ;p
When a kernel debugger can attach to the system (KdPitchDebugger == 0) the possibility exists for software (usermode included) to implement an event object type to be set to the signaled state when a time slip occurs. In this context, a time slip occurs because an exception that is passed to the kernel debugger puts all logical processors in a wait state with interrupts masked off.
No external interrupts from timing chips (pit, hpet) can occur. Thus when the logical processor(s) are continued, the machine is living in the past so to speak. Time keeps on slippin slippin slippin...
But..
Prior to exiting the debugger, KdExitDebugger will insert the KdpTimeSlipDpc DPC object into the processor's DPC queue. This DPC will queue a passive level work item routine (KdpTimeSlipWork) which will set a provided event object to the signaled state, if one is provided. User level software can set this field with NtSetSystemInformation with an infoclass of 0x2E. The windows time service
in particular sets this field when it starts up, that is, if the service is running. However it can still be reset. I haven't really looked over the windows time service but my guess is that when and if it is notified of a time slip, that it probably attempts to synchronize the system back over NTP, but who knows.. haven't looked.
We can be sure that if this DPC is fired that a kernel debugger is attached to the system because the only way the initial DPC can be queued is via KdExitDebugger. Control flow cannot reach that point unless an exception occured which was forwarded to the debugger.
The passive level work routine will queue another timer based DPC object with KiSetTimer with a hardcoded duetime of 94B62E00. This value is relative to the system clock at 179999999900 nanoseconds, or every 180 seconds (3 minutes ;p) that it will attempt to set your provided event
object to the signaled state.
Please note this requires the SeSystemtimePrivilege privilege.
Quick example for clarity:
HANDLE a1=CreateEvent(NULL,FALSE,FALSE,NULL);
NtSetSystemInformation(0x2E,&a1,8);
if(WaitForSingleObject(a1,1)==WAIT_OBJECT_0) //kernel debugger attached
Subscribe to:
Comments (Atom)

