This higher level API is provided to application developers in order to count IO transactions for a process, or a job object (group of processes). Even with such an innocent face, it can easily be used to determine if the process has an active debug port.
The IO_COUNTERS structure, which is filled as a result of the call, tells us operation counts, and byte transfer counts. If you don't already know, it's pretty simple:
Read operation count - Pending or completed IO with NtReadFile
Write operation count - Pending or completed IO with NtWriteFile
Other operation count - IO with NtCreateFile/NtDeviceIoControlFile/NtFsControlFile (not limited to these, the list goes on NtCancelIoFileEx, NtQueryDirectoryFile, etc).
When a debugger is attached and it's target calls NtMapViewOfSection (hint, mapping a dll image) for a section object that is an image, it will queue a debug event. Included in this debug event, is a file handle to the image, the debugger thread waiting on the port then calls ObDuplicateObject to provide a file handle as part of it's debug message to the application.
In Peter Ferrie's anti-debug paper, he describes how to deduce that a debugger is attached due to the debugger end not closing it's duplicated handle thereby preventing exclusive access to the file.
This method however is not based off whether the debugger code forgets to close the handle, or uses it (either way preventing exclusive file access) but instead will work regardless, even if the debugger does not use the file handle and closes it upon reception. This is because the initial handle is opened within the context of the target via NtOpenFile (therefore increasing OtherOperationCount by 1), and although closed before NtMapViewOfSection returns, the fact that it incremented means the process has a debug port to dispatch messages to. Otherwise NtOpenFile would never be called, and the other operation count would not increment.
So detection can be as a simple as:
GetProcessIoCounters((HANDLE)-1,pio_counters);
//store other operation count somewhere
MapViewOfFile(); //remember, only builds a debug event if it's an image
GetProcessIoCounters((HANDLE)-1,pio_counters);
//check otheroperationcount, if incremented, asplode.
Monday, November 11, 2013
Sunday, October 20, 2013
Tricky and powerful anti-tracing mechanisms with BTF and LBR
If you haven't already read this,
you probably should. It covers the fundamentals of what will be
discussed here. That way, I can assume you already know what is going on
and I don't have to cover all the miniscule details in this post :)
Back already eh?
Simply setting the trap flag with an iret/popf variant has always been a common technique to thwart single-stepping. There are also API's to offer similar functionality, we wont cover them today because that isn't really the scope here.
One of the most common is something similar to this:
As you know, when the boundary of xor eax, eax is reached, we will have an int 01 trap with a saved IP of whatever follows it. Again as you should hopefully know, this is common method to trick a debugger that is already single stepping this sequence into thinking that it caused the exception and to continue right along. Now any debugger worth its weight in (bytes? gold? plugins?), or a user who isn't just auto-tracing and looking manually, should catch this.
There are a few plugins already for various debuggers that check the trap flag status prior to popf/iret/syscall/ints and attempt to act accordingly, like resuming the trace operations at KiUserExceptionDispatcher.
Now lets look at this sequence again, but imagine that BTF is enabled.
Now lets throw OllyDbg into the mix and step through this sequence. You will notice how Olly will single step normally normally over the sequence. Olly will mask off Dr7.BTF after debug event, even if it passes the event back to user code. This means the following situations could easily happen:
-A user or a plugin unaware of this during a trace could mistakenly let the application process a single step exception which followed an instruction that set EFLAGS.TF. The application would see this and act accordingly (like.. explode or something.)
-Ollydbg AND WinDbg both mask off Dr7.BTF when sending an exception back to KiUserExceptionDispatcher. This means that for the duration of the exception chain dispatching, BTF will have no effect.
So the following scenario would ensue:
The following is executed while debugger is attached.
IDA's win32 debugger and Cheat Engine do not have this problem, but don't worry, we have something up our sleeve for them. Also a quick side-note here; a year or so ago, a colleague of mine made some real fun of me for using Cheat Engine as a dynamic analysis and debugging tool. Contrary to whatever he thinks, anyone who does this as a passion loves Cheat Engine. The arsenal just isn't complete without it.
Here is how we can fool them all.
Reminder: LBR data will only be written to the ExceptionInformation structure if the trap flag is set when a #DB exception occurs. In this case we use ICEBP for our #DB. ICEBP for all intents and purposes is a #DB exception.
So if we single step OR branch step over the following magical sequence, it will easily be detectable:
If no debugger is tracing this sequence, the ExceptionInformation fields rendered to our application via the EXCEPTION_RECORD structure will contain the linear address of the 'je 02h' instruction, and the second field will contain the linear address of the 'mov ecx, edx' instruction.
If a debugger were single stepping over this sequence, it's implied that it masked Dr7.BTF, and maybe even Dr7.LBR. In either case, even if it only masked one, the ExceptionInformation fields will have a null index, and no data.
Furthermore, if the debugger were branch tracing instead of single stepping over this sequence meaning it left BTF and LBR on, the ExceptionInformation data would contain the linear address of KiDebugTrapOrFault's IRET instruction, followed by the linear address of 'mov ecx, edx. If the debugger for some reason decided to mask off LBR but leave BTF enabled, ExceptionInformation index would be null and the fields would be empty.
In either of the above case, if the debugger didn't preserve LBR or BTF, the improper values would be stored in the ExceptionInformation fields, and we could assume a debugger is attached.
The BTF and LBR Dr7 backdoors exist from XP to Windows 8 in both 32 and 64 bit editions of Windows making this a highly portable anti-debug/trace technique.
Back already eh?
Simply setting the trap flag with an iret/popf variant has always been a common technique to thwart single-stepping. There are also API's to offer similar functionality, we wont cover them today because that isn't really the scope here.
One of the most common is something similar to this:
pushf
or word ptr [sp], 0100h
popf
xor eax, eax
xor ebx, ebx
nop
As you know, when the boundary of xor eax, eax is reached, we will have an int 01 trap with a saved IP of whatever follows it. Again as you should hopefully know, this is common method to trick a debugger that is already single stepping this sequence into thinking that it caused the exception and to continue right along. Now any debugger worth its weight in (bytes? gold? plugins?), or a user who isn't just auto-tracing and looking manually, should catch this.
There are a few plugins already for various debuggers that check the trap flag status prior to popf/iret/syscall/ints and attempt to act accordingly, like resuming the trace operations at KiUserExceptionDispatcher.
Now lets look at this sequence again, but imagine that BTF is enabled.
pushfNow lets just assume for a minute that no debugger is attached. Execution will continue right along after popf/popfd and no trap will be recognized. This as you know is because even though TF is set, we haven't hit a taken branch. Thus no trap. We could then modify our sequence a bit into something like this:
or word ptr [sp], 0100h
popf
xor eax, eax
xor ebx, ebx
nop
pushf
or word ptr [sp], 0100h
popf
xor eax, eax
xor ebx, ebx
nop
jmp 02h
xor eax, eax
nop
The trap will occur after the boundary of the unconditional jump is reached. The application can then handle accordingly.
Now lets throw OllyDbg into the mix and step through this sequence. You will notice how Olly will single step normally normally over the sequence. Olly will mask off Dr7.BTF after debug event, even if it passes the event back to user code. This means the following situations could easily happen:
-A user or a plugin unaware of this during a trace could mistakenly let the application process a single step exception which followed an instruction that set EFLAGS.TF. The application would see this and act accordingly (like.. explode or something.)
-Ollydbg AND WinDbg both mask off Dr7.BTF when sending an exception back to KiUserExceptionDispatcher. This means that for the duration of the exception chain dispatching, BTF will have no effect.
So the following scenario would ensue:
The following is executed while debugger is attached.
mov rcx, hThread //thread handleThe application must have wanted this, so pass it back. But since the debugger masked Dr7.BTF, setting the trap flag in your exception handler with popf/iret will cause a trap at following instruction boundary. Otherwise nothing would happen until you either A. reset the flag, or b, hit a taken branch. This is ample evidence that a debugger is involved.
mov rdx, context //context setting LBR and BTF
call SetThreadContext
//random crap
nop
xor ebx, ebx
mov eax, 0x1
shl rax, 0x10
//cause some kind of event
int 3
IDA's win32 debugger and Cheat Engine do not have this problem, but don't worry, we have something up our sleeve for them. Also a quick side-note here; a year or so ago, a colleague of mine made some real fun of me for using Cheat Engine as a dynamic analysis and debugging tool. Contrary to whatever he thinks, anyone who does this as a passion loves Cheat Engine. The arsenal just isn't complete without it.
Here is how we can fool them all.
Reminder: LBR data will only be written to the ExceptionInformation structure if the trap flag is set when a #DB exception occurs. In this case we use ICEBP for our #DB. ICEBP for all intents and purposes is a #DB exception.
So if we single step OR branch step over the following magical sequence, it will easily be detectable:
//LBR and BTF already setOur first assumption is that the debugger is smart enough to detect ICEBP, whether it be by decoding the instruction stream or checking Dr6, and then passing the exception back to the application. If this isn't happening then the application already wins this round because the exception chain was never dispatched.
inc eax
cmp eax, 0x5
je 02h
xor ebx, ebx
mov ecx, edx
popfd //sets trap flag
icebp
If no debugger is tracing this sequence, the ExceptionInformation fields rendered to our application via the EXCEPTION_RECORD structure will contain the linear address of the 'je 02h' instruction, and the second field will contain the linear address of the 'mov ecx, edx' instruction.
If a debugger were single stepping over this sequence, it's implied that it masked Dr7.BTF, and maybe even Dr7.LBR. In either case, even if it only masked one, the ExceptionInformation fields will have a null index, and no data.
Furthermore, if the debugger were branch tracing instead of single stepping over this sequence meaning it left BTF and LBR on, the ExceptionInformation data would contain the linear address of KiDebugTrapOrFault's IRET instruction, followed by the linear address of 'mov ecx, edx. If the debugger for some reason decided to mask off LBR but leave BTF enabled, ExceptionInformation index would be null and the fields would be empty.
In either of the above case, if the debugger didn't preserve LBR or BTF, the improper values would be stored in the ExceptionInformation fields, and we could assume a debugger is attached.
The BTF and LBR Dr7 backdoors exist from XP to Windows 8 in both 32 and 64 bit editions of Windows making this a highly portable anti-debug/trace technique.
Tuesday, October 15, 2013
User/kernel shared page continued...
This is a continuation of the original post
Finally had some time to look this one over. As you hopefully recall in the previous installment I mentioned how I noticed data fluctuation in the same area of the page for 32 bit builds of Windows 7 (haven't checked 8 for either build yet).
As I guessed it's pretty much the same functionality (garbage stack portion) and can be used to infer /debug. This is the mode where a kernel debugger is not necessarily attached, but can be at anytime. Other indicators such as KdDebuggerEnabled at 0x2D4 or KdDebuggerNotPresent which as you know can be queried with NtQuerySystemInformation will not be of any value.
Anyways in this case, it's close to the same but not entirely. KdInitSystem parses the load options, if /debug is set, we expand our stack further than anticipated for a normal boot phase and land at DbgLoadImageSymbols which uses int 2D (debugger services, like symbols ;p) regardless of whether or not a KD is actually present, if not it's just caught by exception handlers in this case.
Now since we grew the stack quite a bit, and the stack pages were zeroed to begin with, we find ourselves at KiInitializeXStatePolicy. This function writes vendor specific extended processor feature bits into the shared page. It allocates a good 0x450 bytes, which then uncovers the garbage left behind (or is it?) from the DbgLoadImageSymbols interrupt control transfer and exception dispatch.
If the value at 0x4C0 is non-zero, this is enough to indicate. It is highly improbable that the Xsave features will extend that far, but starting at Xsave and searching at a 4 byte boundary for 0xFFFFFD34 would be a more appropriate solution. Similar to the 4 byte 'DBGP' signature for 64 bit builds.
This applies to an original deployed 32 bit copy, all the way to the most recent Windows updates.
Keep in mind this is only for 32 bit builds of Windows 7. The same deal exists in x86/64 targets but is a slightly different story.
Tuesday, July 23, 2013
Kernel/user shared page kernel debugger detection (x64)
No no, this isn't the single byte indicator at 0x2D4. Just in case you had maybe thought I lost my mind or something. I did however lose my mind over dictating whether or not they did this on purpose. Read on and post your thoughts.
Lets imagine an operating instance with no outstanding boot flags used to enable the kernel debugger. The data beyond the xsave features area (fpu xstor features etc) may look something like this:

Nothing out of the ordinary eh?
Alright. Lets boot with /debug and com port 1
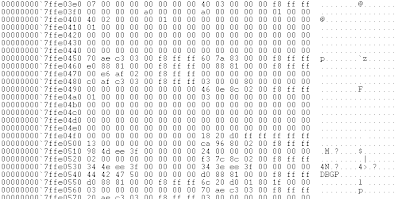
Wow would you look at all this extra data. Hey I even see a string 'DBGP'! Lets analyze what is really going on here to see if this is on purpose or just simply some kind of accident. After KiSystemStartup passes the loader parameter block to KdInitSystem, KdInitSystem dictates whether or not to initialize the kernel debugger based off of the boot parameters. It is at this point of deciding where our kernel stack is in the current state. You'll have to excuse my art skills though, no fancy crayon drawings today:
data higher
then SP. in use.
↑
RSP
↓
data lower
then SP. not
allocated (garbage)
As KdInitializeDebugger goes through it's layers of execution, needless to say it expands SP as it goes. DBGP is actually an ACPI table in which HAL determines if existing and capable debug ports do exist. For example it ensures that the com port is an actual 16550 UART. This isn't limited to just serial ports, as you know, debugging over USB/network/IEEE is also available. ACPI simply states whether or not these interfaces abide by the Microsoft debugging standard. For instance the USB host controllers must have a debug interface, or it cannot be used for this purpose.
It just so happens that during this process, the table identifier 'DBGP' is saved to the stack prior to asking HAL to look up the table ;p
Thus when KdInitializeDebugger unravels itself, this extra data along with our lovely friend DBGP still exist in the garbage portion of the stack. Ok you are with me so far, that is good, lets continue.
A short time later, KiComputeEnabledFeatures allocates itself a structure to fill for xsave features. It just so happens that this structure overlaps the garbage left behind from KdInitializeDebugger. Otherwise the structure would in fact be zeroed out because it has not been used prior. This structure is then written to the xsave features portion of the kernel/user shared page, and contains this extra information. This extra information is enough to infer presence of a kernel debugger because without /DEBUG KdInitializeDebugger is never called.
This heading is also labeled as (x64). I did look at windows in legacy operating mode but didn't notice the same results however there was some fluctuation, perhaps enough to detect the same flags. When I get more time I will have a look.
Now whether or not this is on purpose, you can decide :)
Tuesday, July 2, 2013
Time slip DPC kernel debugger detection
Been quite awhile since my last entry. Spent some time in Key West, FL and spent some more time moving to the other side of town. I have a some fun things to post about over the next month or so. So stay tuned ;p
When a kernel debugger can attach to the system (KdPitchDebugger == 0) the possibility exists for software (usermode included) to implement an event object type to be set to the signaled state when a time slip occurs. In this context, a time slip occurs because an exception that is passed to the kernel debugger puts all logical processors in a wait state with interrupts masked off.
No external interrupts from timing chips (pit, hpet) can occur. Thus when the logical processor(s) are continued, the machine is living in the past so to speak. Time keeps on slippin slippin slippin...
But..
Prior to exiting the debugger, KdExitDebugger will insert the KdpTimeSlipDpc DPC object into the processor's DPC queue. This DPC will queue a passive level work item routine (KdpTimeSlipWork) which will set a provided event object to the signaled state, if one is provided. User level software can set this field with NtSetSystemInformation with an infoclass of 0x2E. The windows time service
in particular sets this field when it starts up, that is, if the service is running. However it can still be reset. I haven't really looked over the windows time service but my guess is that when and if it is notified of a time slip, that it probably attempts to synchronize the system back over NTP, but who knows.. haven't looked.
We can be sure that if this DPC is fired that a kernel debugger is attached to the system because the only way the initial DPC can be queued is via KdExitDebugger. Control flow cannot reach that point unless an exception occured which was forwarded to the debugger.
The passive level work routine will queue another timer based DPC object with KiSetTimer with a hardcoded duetime of 94B62E00. This value is relative to the system clock at 179999999900 nanoseconds, or every 180 seconds (3 minutes ;p) that it will attempt to set your provided event
object to the signaled state.
Please note this requires the SeSystemtimePrivilege privilege.
Quick example for clarity:
HANDLE a1=CreateEvent(NULL,FALSE,FALSE,NULL);
NtSetSystemInformation(0x2E,&a1,8);
if(WaitForSingleObject(a1,1)==WAIT_OBJECT_0) //kernel debugger attached
Wednesday, March 13, 2013
KeLoaderBlock and you
My goal of this blog is to generally post undocumented details of the Windows operating system. By details I mean topics that would interest both software reverse-engineers and malware analysts alike. One of those topics to me is a lot more prominent then the rest, and that is mechanisms that attempt to detect or evade debugging. Whether it be DRM or actual malware, I'd have to say it's my favorite topic.
What were going to discuss today has probably already been discussed elsewhere, however out of all the methods used to detect if a kernel debugger is attached to the system, I think this one is hardly used or mentioned. Therefore I think it warrants a quick discussion today.
As you probably already know, KeLoaderBlock is the first argument to KiSystemStartup. Among a plethora of other details this structure contains the boot flags from the current BCD entries corresponding our current boot. For instance boot option selection timeout, test-signing, NX opt in or opt out, /debug flags for the kernel debugger etc.
KeLoaderBlock is not accessible from user-mode, but I'm always surprised that many are unaware that during initialization, the startup flags are written to the following registry fields.
HKLM\System\CurrentControlSet\Control - SystemStartOptions
From these flags the software can easily find out if the system was booted with /TESTSIGNING or /DEBUG ON
This method we discussed as you can see is very simple. So simple that it's often overlooked.
Friday, March 8, 2013
2 anti-tracing mechanisms specific to windows x64
In this context, the term "anti-trace" refers to detecting the mode in which the processor causes a #DB exception after every instruction boundary or in the case of branch tracing, a #DB exception after each successful branch is taken, due to RFLAGS.TF being set.
Please note that under long-mode and windows x64 that the first method I am about to describe will in fact work under the wow64 subsystem, however it only works because of the long-mode implementation. It's best to leave these methods in 64 bit mode code only, because they will not function without long-mode and windows x64.
Nested task bit
The nested task bit of RFLAGS was used and set by the legacy task switching system when the processor would transfer control through a task-gate, a task segment or the actual TSS descriptor in the GDT itself. When this happened, the processor would set EFLAGS.NT. This would enable a subsequent IRET to use the TSS backlink selector to return to the previous task. However like the segmented memory model, the hardware task switching mechanism was hardly used. The only purpose it served in most cases was for storing stack pointers for different privilege levels.
In 64-bit mode, most of the segmented memory model was done away with. Except for GS, FS and system descriptors, the base is always treated as zero, and the displacement offset usually found in a general purpose register is treated as the actual linear address.
The same goes for the hardware task switching model. In long-mode it's purpose is to hold stack pointers for each CPL change and an IST which can be used for secure stacks when needed for NMI's etc.
Thus since there is no TSS backlink for an IRET to dispatch to, nor is the hardware task switching mechanism even available in long-mode, an IRET with RFLAGS.NT=1 will cause a general protection exception. In user-mode, depending on the scenario, these are usually dispatched as STATUS_ACCESS_VIOLATION (0xC0000005).
Now when the trap flag is set for a task we know that a debug exception will occur at the next instruction boundary, the trap flag is also set on the interrupt handler stack RFLAGS image, however... prior to dispatching the exception the kernel will mask the trap flag in the RFLAGS image to 0. As you already know then, this requires the user level debugger code to call SetThreadContext to reenable the trap flag to continue single-stepping (or branch tracing). However an interesting thing occurs in x64 kernels as we have a look at PspSetContext. This function is part of the APC routine used to modify a thread's context on it's saved trap-frame.
If the CONTEXT_CONTROL flag is specified in the ContextFlags member (which it needs to be in order to mask on RFLAGS.TF to continue single-stepping), PspSetContext will mask off RFLAGS.NT each time it's called. This means that if we are single-stepping over an IRET which has RFLAGS.NT=1 no general protection fault will be generated, otherwise it will be.
Here is another interesting scenario, this isn't just limited to detecting tracing. Notice how PspSetContext will mask off RFLAGS.NT each time the APC is queued to the thread and the CONTEXT_CONTROL flag is set? CONTEXT_CONTROL is not only used for RFLAGS it is used for the instruction pointer as well as other general purpose registers. Lets say somewhere during the initialization of our program we set RFLAGS.NT. Then somewhere down the road we use the IRET gp fault mechanism to cause some indirection. If at any time a debugger has re-adjusted the context of our thread with CONTEXT_CONTROL (which it would need to do for int3 ;p), we can assume a debugger is attached because RFLAGS.NT will no longer be set and therefore no GP fault will be generated.
Hopefully you see how this goes beyond just a simple anti-tracing mechanism to a pretty powerful anti-debugging trick altogether.
Alignment check
The second is based off of the exact same logic we just discussed, except in this case it is applied to RFLAGS.AC. When this flag is set it causes an alignment check fault when the task attempts to access data that is not a multiple of the operand offset. For example the following instruction would cause an alignment check fault if RFLAGS.AC was masked on:
mov rax, qword ptr [rsp+04h]
However following the same logic with our above discussion, this flag is also masked off each time PspSetContext is called. Thus if we were stepping over it, it would not generate an alignment check fault. The same logic also applies if PspSetContext is called at any point after RFLAGS.AC is set, it will be unmasked, and not cause a fault at the desired location.
An important thing to note however is that the first mechanism we described today (Nested task bit) will work within wow64. However the x64 kernel will not dispatch alignment faults that are generated in user-mode within the context of a wow64 process. Instead it will simply mask off RFLAGS.AC and IRET to the faulted instruction. This is why these methods should be left strictly to code that runs in a 64 bit process.
Sunday, March 3, 2013
Utilizing paged virtual memory as an anti-debug and anti-dumping mechanism
The Windows memory manager logic is designed around performance,
reliability, physical page re purposing, sharing, low disk writes and a
hierarchy of named objects and directories. Today we are going to talk
about paged memory, user-mode memory in particular.
In most cases as you probably already know, unless specified otherwise, the memory your user-mode software uses is paged. This means prior to first access to the page, there is no associated physical page frame. This is because the Windows memory manager wont commit a physical page until it's absolutely needed. This is done via a page fault.
A page fault is an interrupt and therefore takes more processing time to dispatch the interrupt, find an unused physical page (or in the case of an image, a shared one) and add it into the corresponding page tables for that virtual address. Each process has a 'working set' limit and a list which contains virtual addresses that have valid translations and should not be paged out. This is to reduce time spent dispatching page faults which can otherwise cause the process to take a major performance hit.
When you allocate memory to your process from user-mode, for example VirtualAlloc or NtMapViewOfSection, these functions do not actually set up mappings to pfn's in the process' page tables. Instead it allocates VAD nodes (virtual address descriptors) in the process' VAD tree. Each process has a VAD tree, these nodes represent and describe valid virtual addresses within the process address space. This is the area that the VirtualQuery function gets it's data from.
Now notice I said that a virtual address translation is not created. As said before, the windows memory manager isn't going to commit a page frame or page in the already paged out data until it's absolutely needed. So lets do a basic walk through of NtAllocateVirtualMemory:
-Find an empty address range within the VAD tree
-Allocate a VAD node describing the memory
-Return
Now lets say our return virtual address value is 0x30000 and is a 4kb page.
When we access this page for the first time, there is no valid translation so a page fault is generated. The VAD trees are used to resolve the page fault, a physical page is committed and we IRET right back to the faulted instruction and is generally unbeknownst to the program or the program's author as if the memory was always available.
Wouldn't it be neat if there was a way to see if the page translation is valid for an arbitrary virtual address other then just VirtualQuery telling us it's there even though it's not really been paged in yet?
Well of course there is! NtQueryVirtualMemory provides an infoclass of 0x4 which we can call ProcessWorkingSetInfoEx and there is even a higher level API which will do the dirty working for us called QueryWorkingSetEx.
This is how we can easily determine if the page has ever been read. For instance the kernel implementation of NtReadVirtualMemory will directly access the virtual address, if it's not valid, it will be paged in and it's contents returned to the caller. By examining if bit 0 is set or not in the data provided to us by QueryWorkingSetEx we can determine if the page table entry is valid for that virtual address, if it is, this means the memory has been accessed.
Another way is to use NtRaiseException. Specify the newly allocated virtual address as the instruction pointer in the context argument, and be sure to set the contextflags accordingly. Most debuggers will then read the instruction contents of the instruction pointer address for dis-assembly and this will indicate that a debugger is undoubtedly present.
Another method not involving the use of an API would be to measure time deltas using the kernel/user shared page or processor cycles with rdtsc between instructions that access memory from the linear virtual address. This is because the time to dispatch the page fault will be extremely noticeable compared to a few cycles to access already available memory.
Use your imagination, there are many possibilities ;p
Monday, February 25, 2013
Infer debugger presense by counting context switches and cycle time
For each thread quantum (in this case, the time that a single logical thread gets on a physical processor), windows will keep track of each time KiSwapContext is called and returns to the saved thread state (stack, registers) for that thread. Each time this happens, SwapContext will increment the ContextSwitchCount member of the KTHREAD structure. We will be using the following native API's:
NtQuerySystemInformation
NtQueryInformationThread
I recommend using 2 threads for probing ContextSwitchCount as an anti-debug mechanism, it's not required but otherwise you have to ensure the current thread is near the beginning of it's cycle time. Otherwise a context switch could occur at the next DPC interrupt. As for probing cycle time itself as an anti-debug mechanism, 2 threads is required.
First I will explain probing ContextSwitchCount then afterwards, the thread cycle time.
Step 1 is to create an additional thread in our application. These will be extremely simple and vague examples ;p
All this thread will do is wait on a synchronization object.
ULONG Waiter(HANDLE event1)
{
WaitForSingleObject(event1,INFINITE);
}
int main()
{
HANDLE event1=CreateEvent(NULL,FALSE,FALSE,NULL);
CreateThread(NULL,0,(LPTHREAD_START_ROUTINE)Waiter,(LPVOID)event1,0,NULL);
//...
//...
}
Step 2. We will call NtQuerySystemInformation and locate our SYSTEM_PROCESS_INFORMATION structure. We will then navigate to the SYSTEM_THREAD_INFORMATION structure for the thread we have just created. We will wait until it has entered a waiting state (0x5). Once we have established that the thread is waiting, we will store it's ContextSwitchCount.
int main()
{
//...
//...
SYSTEM_PROCESS_INFORMATION π
SYSTEM_THREAD_INFORMATION &ti;
ULONG SwitchCount;
//Call NtQuerySystemInformation. Assign a structure pointer.
do
{
NtQuerySystemInformation(SystemProcessandThreadInformation,&heapbuffer,heapbuffersize,&len);
} while(ti->ThreadState!=0x5);
SwitchCount=ti->ContextSwitches;
}
Like I said, vague examples ;p
Step 3. At this point we have established the fact that our secondary thread is waiting on our synchronization object. We have also stored and saved it's last ContextSwitchCount. When a thread is waiting on a synchronization object, it is not added to the ready queue until either a kernel APC is queued to the thread, or the sync object is signaled.
In our main thread we will trigger an exception, this can be anything. For the sake of simplicity we will just use int3.
int main()
{
//...
//...
_asm
{
push handler
push fs:[0x0]
mov fs:[0x0], esp
int 3
}
}
I don't really know why I'm putting a code example for that one, but there it is. At this point, lets assume since int3 is a trap exception, (but even though SEH uses ExceptionAddress, so EIP-1), we advance our instruction pointer ahead one byte, then resume execution.
Step 4. We once again call NtQuerySytemInformation and walk through the SystemProcessandThreadInformation buffer to locate our process and our waiting thread, and probe it's context switch count.
int main()
{
//...
//...
//...
//Call NtQuerySystemInformation, walk buffer to our thread data
if(ti->ContextSwitches>SwitchCount)
{
//debugger detected, do something
}
}
As you can see, we compare our waiting thread's current context switch count to the previous value we probed. If it is higher, a debugger was attached to the process when we generated our exception and here is why:
When a thread generates an exception and a debug port is present for the process, it calls DbgkSuspendProcess to suspend all remaining threads in the process, while the thread that generated the exception will go on to wait on the debug object's synchronization mutex until the debugger continues the exception.
The context switch count is incremented because thread suspension is done via kernel APC's. As stated earlier, the waiting thread will be entered into the ready queue in one of 2 cases. Kernel APC's or the object being signaled. The same goes for cycle time. Using the above logic, we can probe the thread's cycle time, generate an exception and then probe it again. If incremented, a debugger is present. To probe cycle time we use NtQueryInformationThread with an infoclass of 0x17.
If no debugger is present, the faulting thread does not suspend remaining threads in wait for the debugger, instead it will resume its execution at KiUserExceptionDispatcher, and the thread we probed which is waiting on the synchronization object will have it's context switch count and cycle time unchanged.
Subscribe to:
Posts (Atom)